Optenni Lab synthesis and optimization results can be visualized using various quantities, e.g. S parameters, efficiencies, voltages, currents, losses etc. In addition to the standard plot controls, Optenni Lab has powerful user plots, where data from different result plots in Optenni Lab and from external files can be combined.
Optenni Lab supports the following user plot types:
- Cartesian user plots, with frequency-dependent X axis data or general X axis data
- Smith user plots
- Radiation pattern user plot (Cartesian and polar cuts only)
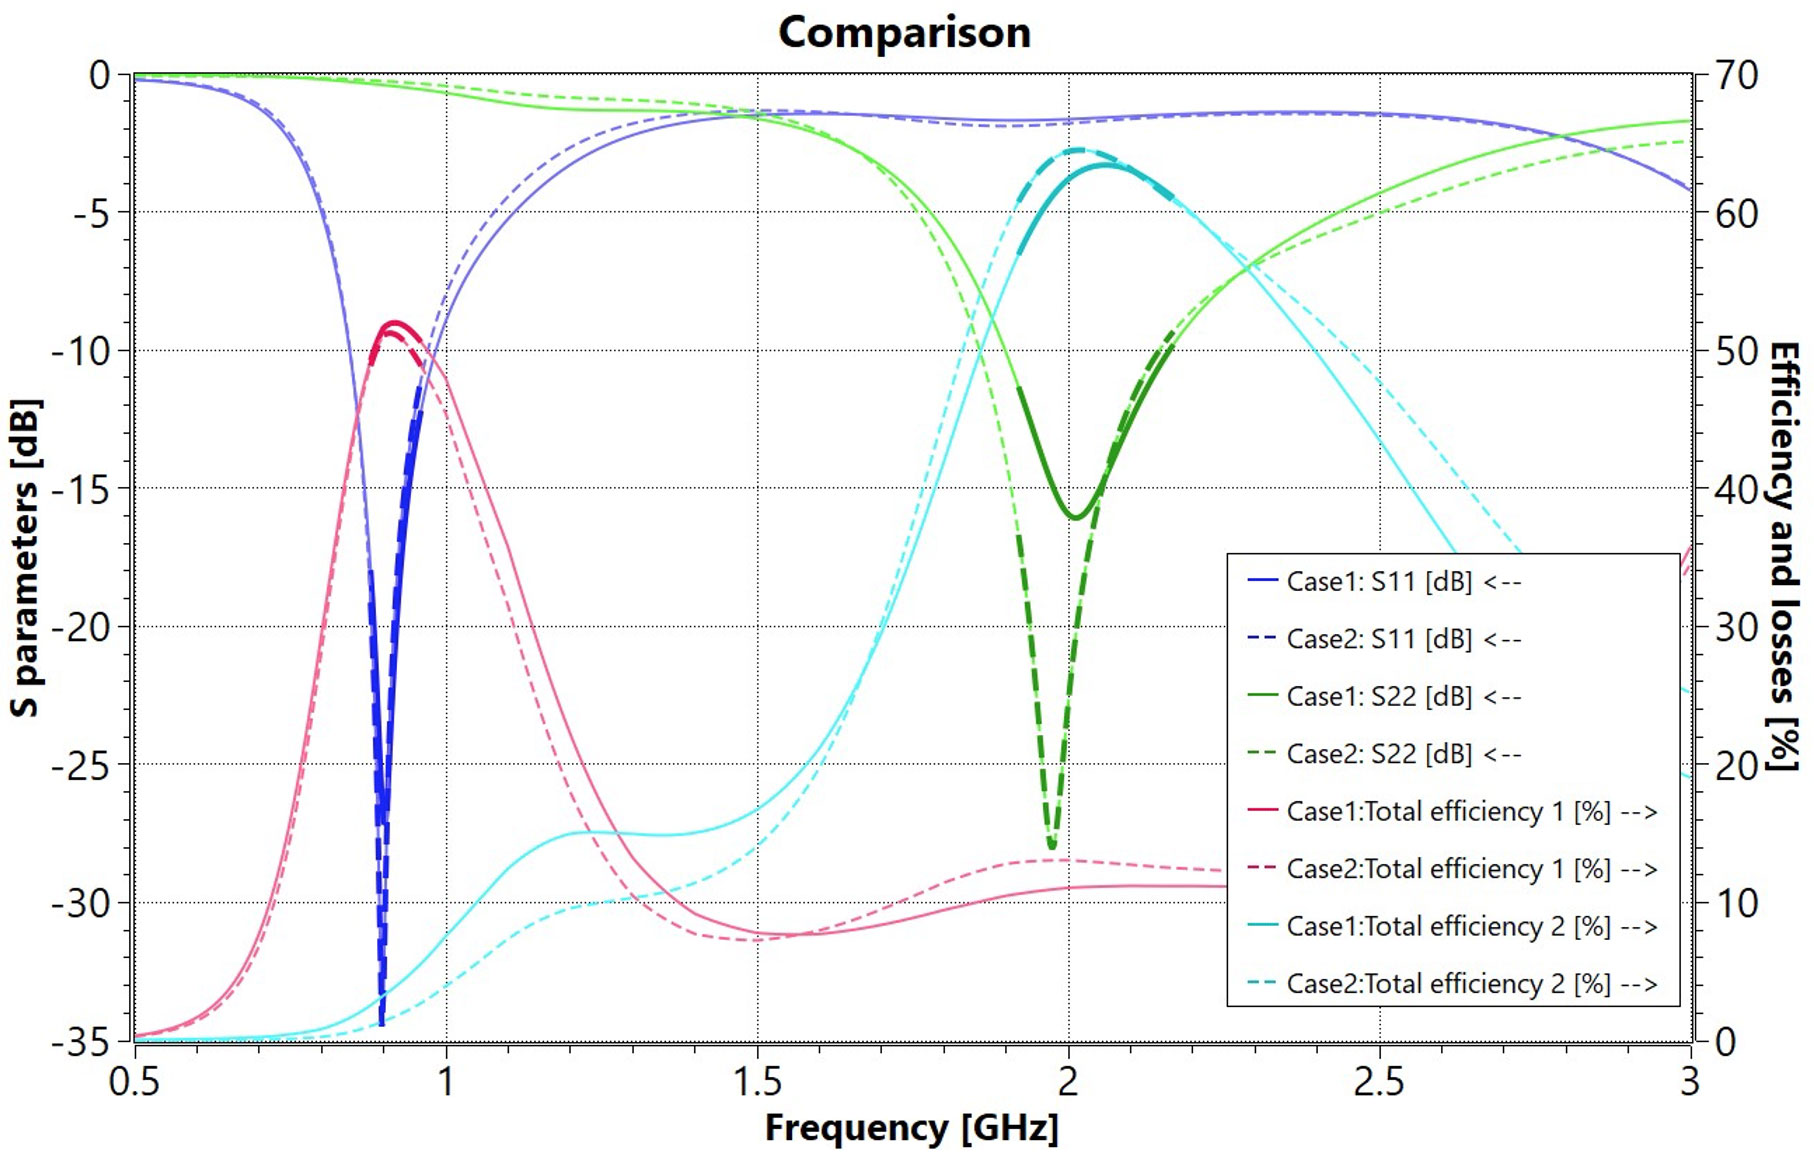
All these plots offer various controls for changing line type, line thickness, colors, font size, axis scaling etc. Publication quality plots can be readily exported in various vector and bitmap graphics formats,
Here is an example of a user plot which shows a comparison of the results from two different simulation cases.

Radiation pattern user plot (Cartesian cut).